Improving memory usage of a Java server
While building a toy HTTP server, it is possible to easily identify things that can impact its performance: how we read a file and send it through a socket is one of those things. There are many, many more variables to that equation if we are dealing with a real world server, but we at least get the basics right while we have only a toy server.
Before digging into the performance issues, I’d like to put a thing out of the way: there are other ways to improve the speed of responses and memory usage. Using the SocketChannel from java.nio is just one of the available alternatives. However, the toy server I’m working on uses java.io and java.net.Socket classes.
Reading files
One of the simplest ways to read a file into a byte array:
byte[] fileToByteArray(File file) throws IOException {
  Path path = Paths.get(file.getAbsolutePath());
  return Files.readAllBytes(path);
}
We can then send the resulting byte array all at once through the socket.getOutputStream (assuming that socket is a java.net.Socket)
For big files, that solution is inefficient. It blocks sending the data until all file is read, and it increases the usage of the heap memory.
Heap memory is the area where the Java objects live. When it is full, the garbage collection happens, getting rid of the objects that are not being used. The Operating System allocates memory in advance to be managed by the JVM. When an object is created, it takes some space in that memory. This goes on until we hit the memory limit. After the garbage collection, the space is freed (when GC is unable to free some space, we get an OutOfMemoryError exception), but that memory is not “given back” to the OS.
When we call write() on the OutputStream, if the byte[] to be written is bigger than 8 KB, the code call other functions so that a new buffer up to 64 KB is created, then the data is copied into that buffer, and then it is sent. All this process can impact performance.
This is a how the heap memory is used when we make 1000 requests and get a 100 MB as response.
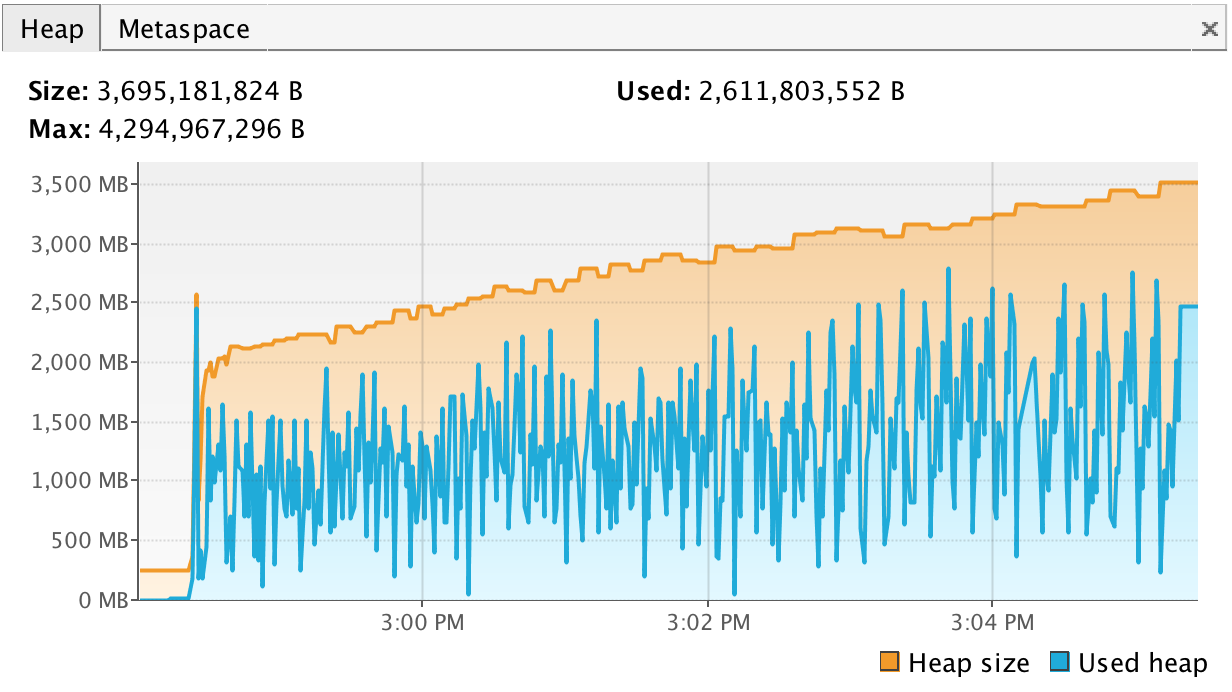
What we see is that it took about 5 minutes and used over 2,500 MB. The usage goes down when the garbage collection happens.
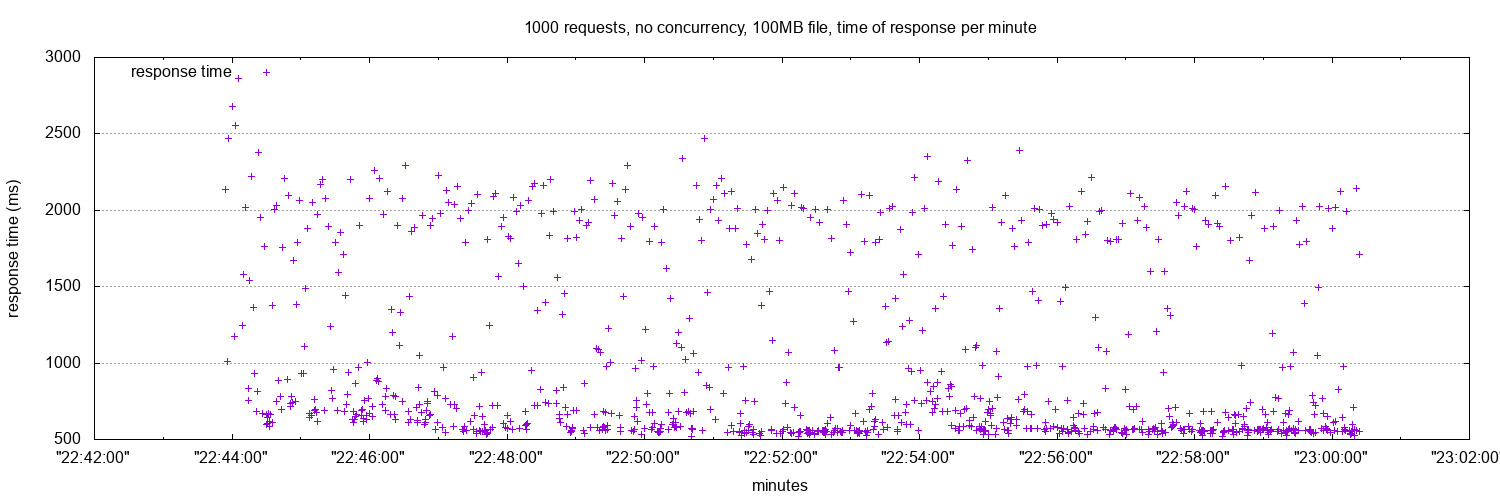
The speed of the responses is also compromised. Here is a graphic that shows how long the responses take as time passes by:
Buffering
A way to improve the memory usage is to read the file into InputStream, instead of directly into a byte[]. This way, we can read the InputStream and send it at the same time, in small steps (at most 8 KB), so that there is no other functions called and not need to allocate more memory.
FileInputStream fis = new FileInputStream(new File(<path-to-big-file>))
byte[] buffer = new byte[1024]; // 1 KB
int bytesRead;
BufferedOutputStream out = new BufferedOutputStream(socket.getOutputStream());
while ((bytesRead = response.read(buffer)) != -1) {
  out.write(buffer, 0, bytesRead);
}
fis.close();
out.flush();
out.close();
This is a how the heap memory is used when we make 1000 requests and get a 100 MB as response when we send the response part by part.
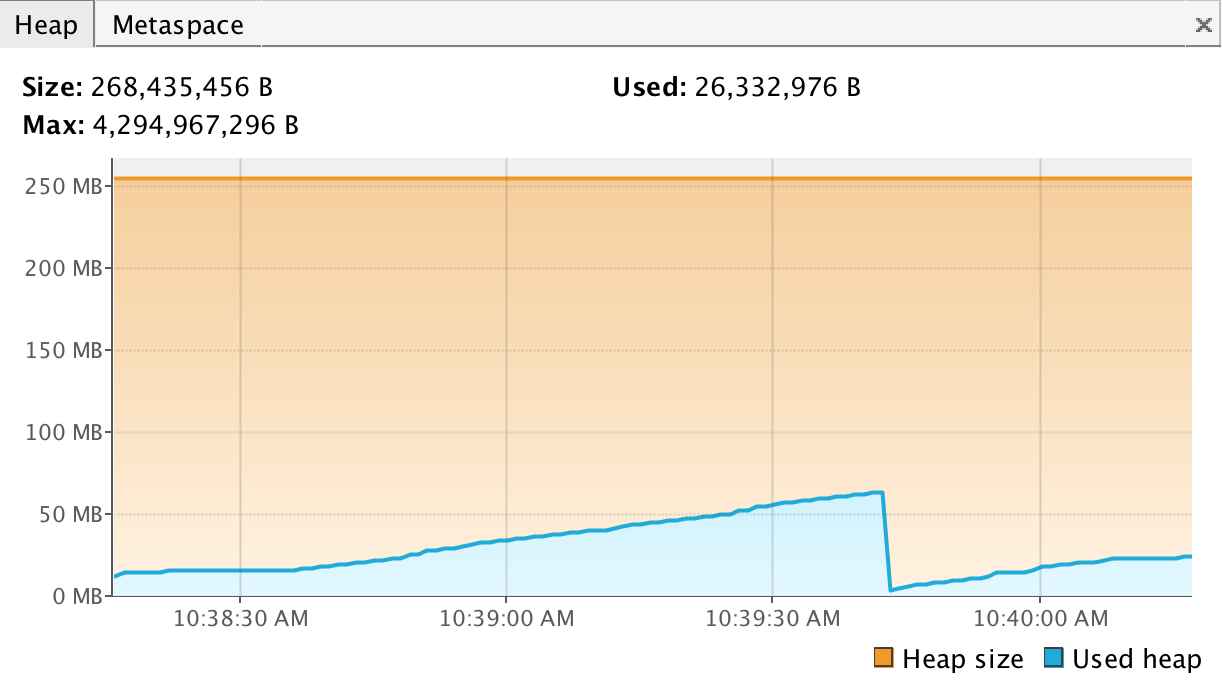
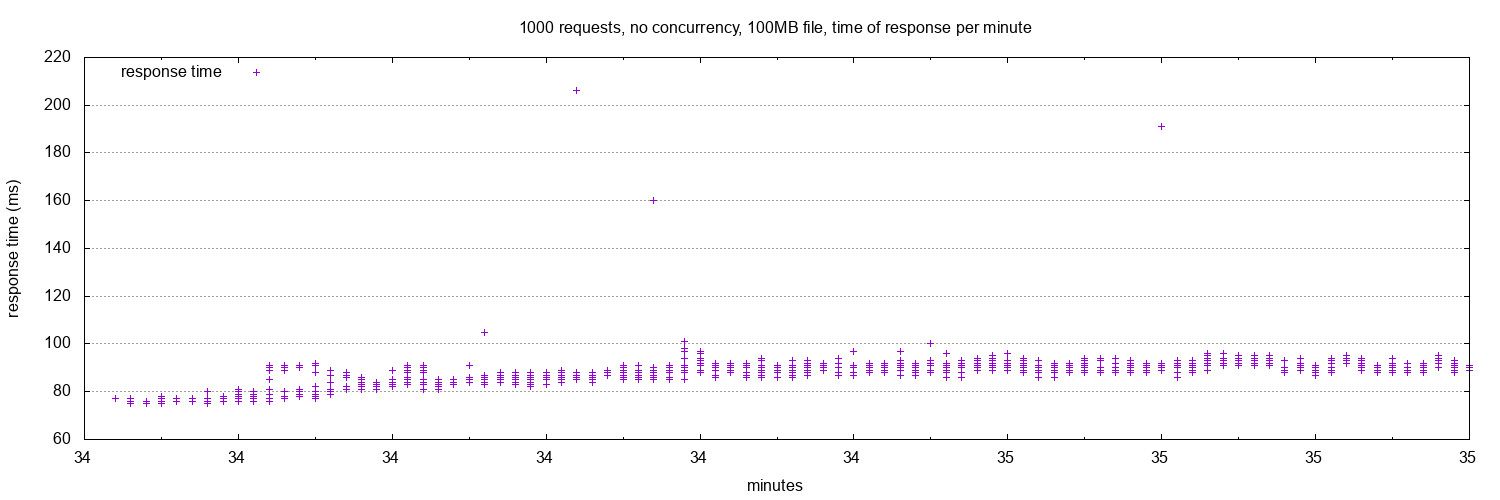
The same test took about 2 to 3 minutes and used over 50 MB. And here is the speed graphic:
Benchmarking tools
The images that illustrate the heap memory usage are screen shots of a VisualVM session. It is a tool that lets us profile a Java application, including CPU, memory usage and thread visualization. It is a GUI application and it is simple to use.
Another tool, now specific to servers, is Apache Bench, that is included in OSX machines and helps us profile the time of the responses. Apache Bench can generate a file with the test data.
# ab 'apache bench'
# -n 'number of requests'
# -c 'number of concurrent requests'
# -g 'generates a .tsv file'
`ab -n 1000 -c 20 -g <some-file.tsv> <some-url>`
The above will output some data to the terminal and generate a file with the following columns:
| starttime | seconds | ctime | dtime | ttime | wait |
|---|---|---|---|---|---|
| start time | start time in seconds | connection | processing | Total | waiting |
Here there is a nice graph explaining what those times are.
Then we can use another tool, GNUplot, that generates graphics (the image of dots showing the time take by responses over time were generated using GNUplot).
The first thing is to write a .p file with instructions for GNUplot — and writing thing file can be complicated if we don’t know what we want from the data we have. Here there is an explanation about how to write it and why do it this way.
A basic file.p file would be (credit to the author of the post mentioned above):
# Set the file to have format jpeg and size 1280x720
set terminal jpeg size 1280,720
# aspect ratio of the graph
set size 1, 1
# write the data to
set output "graph.jpeg"
# title
set title "Benchmark testing"
# legend placement
set key left top
# gridlines are oriented on the y axis
set grid y
# x-series data is time data
set xdata time
# time in the y axis
set timefmt "%s"
# time in the x axis
set format x "%H:%M:%S"
# Label the x-axis
set xlabel 'seconds'
# Label the y-axis
set ylabel "response time (ms)"
# Tell gnuplot to use tabs as the delimiter instead of spaces (default)
set datafile separator '\t'
# Plot the data
plot "<some-file>.tsv" every ::2 using 2:5 title 'response time' with points
exit
The last line explained:
-
plot draws the graphic using the information at **
.tsv** -
every says that we are going to use every row in the table in the
.tsvfile, starting from the second (:: 2), since the first row holds the titles of the rows -
title is the title of the legend/key
-
with points puts all the dots (plus signs) in the graph, instead of using a regular line
Then we just need to run gnuplot <file.p>. This will generate the graphic showing how long the responses take as the time goes on.